Text files and CSV
Pandas
Data in tabular form? Use Pandas package
It can easily read and write text/ascii/csv files
Data is messy? Read the messy data and clean in Pandas
Pandas can deal with column renaming, missing values, column datatypes, date and time settings and timezones
Want to plot all numerical columns in the same axis? Pandas plotting method got you covered
Pandas documentation page has a 10 min guide to get you started
Exercise
We will use Pandas to do the following tasks
Read rainfall data (accessible from data/ directory) for 36 subdivisions in India
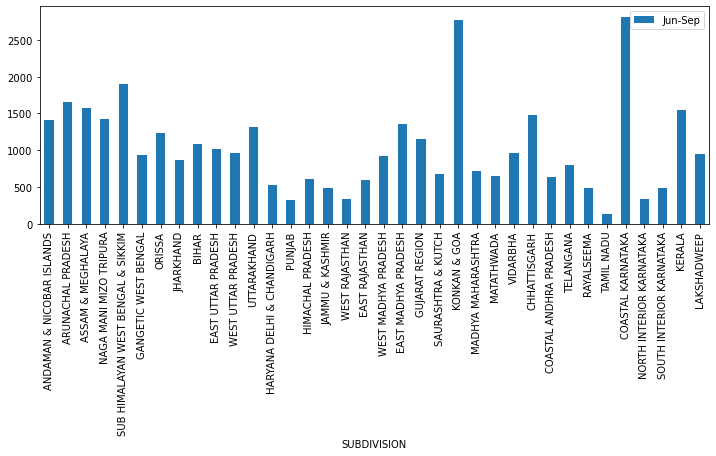
plot summer monsoon rainfall for all divisions for a given year
tidy the data and index it by date
plot time series for selected subdivisions
Data used here is provided by India Meteorological Department(IMD), Govt. of India and downloaded from here
import pandas as pd
import matplotlib.pyplot as plt
# read the data
df = pd.read_csv('data/rainfall_in_india_1901-2015.csv',na_values='nan')
# display first 5 rows
df.head()
| SUBDIVISION | YEAR | JAN | FEB | MAR | APR | MAY | JUN | JUL | AUG | SEP | OCT | NOV | DEC | ANNUAL | Jan-Feb | Mar-May | Jun-Sep | Oct-Dec | |
|---|---|---|---|---|---|---|---|---|---|---|---|---|---|---|---|---|---|---|---|
| 0 | ANDAMAN & NICOBAR ISLANDS | 1901 | 49.2 | 87.1 | 29.2 | 2.3 | 528.8 | 517.5 | 365.1 | 481.1 | 332.6 | 388.5 | 558.2 | 33.6 | 3373.2 | 136.3 | 560.3 | 1696.3 | 980.3 |
| 1 | ANDAMAN & NICOBAR ISLANDS | 1902 | 0.0 | 159.8 | 12.2 | 0.0 | 446.1 | 537.1 | 228.9 | 753.7 | 666.2 | 197.2 | 359.0 | 160.5 | 3520.7 | 159.8 | 458.3 | 2185.9 | 716.7 |
| 2 | ANDAMAN & NICOBAR ISLANDS | 1903 | 12.7 | 144.0 | 0.0 | 1.0 | 235.1 | 479.9 | 728.4 | 326.7 | 339.0 | 181.2 | 284.4 | 225.0 | 2957.4 | 156.7 | 236.1 | 1874.0 | 690.6 |
| 3 | ANDAMAN & NICOBAR ISLANDS | 1904 | 9.4 | 14.7 | 0.0 | 202.4 | 304.5 | 495.1 | 502.0 | 160.1 | 820.4 | 222.2 | 308.7 | 40.1 | 3079.6 | 24.1 | 506.9 | 1977.6 | 571.0 |
| 4 | ANDAMAN & NICOBAR ISLANDS | 1905 | 1.3 | 0.0 | 3.3 | 26.9 | 279.5 | 628.7 | 368.7 | 330.5 | 297.0 | 260.7 | 25.4 | 344.7 | 2566.7 | 1.3 | 309.7 | 1624.9 | 630.8 |
# display last 5 rows
df.tail()
| SUBDIVISION | YEAR | JAN | FEB | MAR | APR | MAY | JUN | JUL | AUG | SEP | OCT | NOV | DEC | ANNUAL | Jan-Feb | Mar-May | Jun-Sep | Oct-Dec | |
|---|---|---|---|---|---|---|---|---|---|---|---|---|---|---|---|---|---|---|---|
| 4111 | LAKSHADWEEP | 2011 | 5.1 | 2.8 | 3.1 | 85.9 | 107.2 | 153.6 | 350.2 | 254.0 | 255.2 | 117.4 | 184.3 | 14.9 | 1533.7 | 7.9 | 196.2 | 1013.0 | 316.6 |
| 4112 | LAKSHADWEEP | 2012 | 19.2 | 0.1 | 1.6 | 76.8 | 21.2 | 327.0 | 231.5 | 381.2 | 179.8 | 145.9 | 12.4 | 8.8 | 1405.5 | 19.3 | 99.6 | 1119.5 | 167.1 |
| 4113 | LAKSHADWEEP | 2013 | 26.2 | 34.4 | 37.5 | 5.3 | 88.3 | 426.2 | 296.4 | 154.4 | 180.0 | 72.8 | 78.1 | 26.7 | 1426.3 | 60.6 | 131.1 | 1057.0 | 177.6 |
| 4114 | LAKSHADWEEP | 2014 | 53.2 | 16.1 | 4.4 | 14.9 | 57.4 | 244.1 | 116.1 | 466.1 | 132.2 | 169.2 | 59.0 | 62.3 | 1395.0 | 69.3 | 76.7 | 958.5 | 290.5 |
| 4115 | LAKSHADWEEP | 2015 | 2.2 | 0.5 | 3.7 | 87.1 | 133.1 | 296.6 | 257.5 | 146.4 | 160.4 | 165.4 | 231.0 | 159.0 | 1642.9 | 2.7 | 223.9 | 860.9 | 555.4 |
# prints info of row and column types
# and the number of non-null values
df.info()
<class 'pandas.core.frame.DataFrame'>
RangeIndex: 4116 entries, 0 to 4115
Data columns (total 19 columns):
 #   Column       Non-Null Count  Dtype
---  ------       --------------  -----
 0   SUBDIVISION  4116 non-null   object
 1   YEAR         4116 non-null   int64
 2   JAN          4112 non-null   float64
 3   FEB          4113 non-null   float64
 4   MAR          4110 non-null   float64
 5   APR          4112 non-null   float64
 6   MAY          4113 non-null   float64
 7   JUN          4111 non-null   float64
 8   JUL          4109 non-null   float64
 9   AUG          4112 non-null   float64
 10  SEP          4110 non-null   float64
 11  OCT          4109 non-null   float64
 12  NOV          4105 non-null   float64
 13  DEC          4106 non-null   float64
 14  ANNUAL       4090 non-null   float64
 15  Jan-Feb      4110 non-null   float64
 16  Mar-May      4107 non-null   float64
 17  Jun-Sep      4106 non-null   float64
 18  Oct-Dec      4103 non-null   float64
dtypes: float64(17), int64(1), object(1)
memory usage: 611.1+ KB
# get the number of null values
df.loc[:,'YEAR':'DEC'].isnull().sum()
YEAR     0
JAN      4
FEB      3
MAR      6
APR      4
MAY      3
JUN      5
JUL      7
AUG      4
SEP      6
OCT      7
NOV     11
DEC     10
dtype: int64
# unique values in a column
df['SUBDIVISION'].unique()
array(['ANDAMAN & NICOBAR ISLANDS', 'ARUNACHAL PRADESH',
       'ASSAM & MEGHALAYA', 'NAGA MANI MIZO TRIPURA',
       'SUB HIMALAYAN WEST BENGAL & SIKKIM', 'GANGETIC WEST BENGAL',
       'ORISSA', 'JHARKHAND', 'BIHAR', 'EAST UTTAR PRADESH',
       'WEST UTTAR PRADESH', 'UTTARAKHAND', 'HARYANA DELHI & CHANDIGARH',
       'PUNJAB', 'HIMACHAL PRADESH', 'JAMMU & KASHMIR', 'WEST RAJASTHAN',
       'EAST RAJASTHAN', 'WEST MADHYA PRADESH', 'EAST MADHYA PRADESH',
       'GUJARAT REGION', 'SAURASHTRA & KUTCH', 'KONKAN & GOA',
       'MADHYA MAHARASHTRA', 'MATATHWADA', 'VIDARBHA', 'CHHATTISGARH',
       'COASTAL ANDHRA PRADESH', 'TELANGANA', 'RAYALSEEMA', 'TAMIL NADU',
       'COASTAL KARNATAKA', 'NORTH INTERIOR KARNATAKA',
       'SOUTH INTERIOR KARNATAKA', 'KERALA', 'LAKSHADWEEP'], dtype=object)
# index by year
df_year = df.set_index('YEAR')
df_year.head(10)
| SUBDIVISION | JAN | FEB | MAR | APR | MAY | JUN | JUL | AUG | SEP | OCT | NOV | DEC | ANNUAL | Jan-Feb | Mar-May | Jun-Sep | Oct-Dec | |
|---|---|---|---|---|---|---|---|---|---|---|---|---|---|---|---|---|---|---|
| YEAR | ||||||||||||||||||
| 1901 | ANDAMAN & NICOBAR ISLANDS | 49.2 | 87.1 | 29.2 | 2.3 | 528.8 | 517.5 | 365.1 | 481.1 | 332.6 | 388.5 | 558.2 | 33.6 | 3373.2 | 136.3 | 560.3 | 1696.3 | 980.3 |
| 1902 | ANDAMAN & NICOBAR ISLANDS | 0.0 | 159.8 | 12.2 | 0.0 | 446.1 | 537.1 | 228.9 | 753.7 | 666.2 | 197.2 | 359.0 | 160.5 | 3520.7 | 159.8 | 458.3 | 2185.9 | 716.7 |
| 1903 | ANDAMAN & NICOBAR ISLANDS | 12.7 | 144.0 | 0.0 | 1.0 | 235.1 | 479.9 | 728.4 | 326.7 | 339.0 | 181.2 | 284.4 | 225.0 | 2957.4 | 156.7 | 236.1 | 1874.0 | 690.6 |
| 1904 | ANDAMAN & NICOBAR ISLANDS | 9.4 | 14.7 | 0.0 | 202.4 | 304.5 | 495.1 | 502.0 | 160.1 | 820.4 | 222.2 | 308.7 | 40.1 | 3079.6 | 24.1 | 506.9 | 1977.6 | 571.0 |
| 1905 | ANDAMAN & NICOBAR ISLANDS | 1.3 | 0.0 | 3.3 | 26.9 | 279.5 | 628.7 | 368.7 | 330.5 | 297.0 | 260.7 | 25.4 | 344.7 | 2566.7 | 1.3 | 309.7 | 1624.9 | 630.8 |
| 1906 | ANDAMAN & NICOBAR ISLANDS | 36.6 | 0.0 | 0.0 | 0.0 | 556.1 | 733.3 | 247.7 | 320.5 | 164.3 | 267.8 | 128.9 | 79.2 | 2534.4 | 36.6 | 556.1 | 1465.8 | 475.9 |
| 1907 | ANDAMAN & NICOBAR ISLANDS | 110.7 | 0.0 | 113.3 | 21.6 | 616.3 | 305.2 | 443.9 | 377.6 | 200.4 | 264.4 | 648.9 | 245.6 | 3347.9 | 110.7 | 751.2 | 1327.1 | 1158.9 |
| 1908 | ANDAMAN & NICOBAR ISLANDS | 20.9 | 85.1 | 0.0 | 29.0 | 562.0 | 693.6 | 481.4 | 699.9 | 428.8 | 170.7 | 208.1 | 196.9 | 3576.4 | 106.0 | 591.0 | 2303.7 | 575.7 |
| 1910 | ANDAMAN & NICOBAR ISLANDS | 26.6 | 22.7 | 206.3 | 89.3 | 224.5 | 472.7 | 264.3 | 337.4 | 626.6 | 208.2 | 267.3 | 153.5 | 2899.4 | 49.3 | 520.1 | 1701.0 | 629.0 |
| 1911 | ANDAMAN & NICOBAR ISLANDS | 0.0 | 8.4 | 0.0 | 122.5 | 327.3 | 649.0 | 253.0 | 187.1 | 464.5 | 333.8 | 94.5 | 247.1 | 2687.2 | 8.4 | 449.8 | 1553.6 | 675.4 |
# cell magic command to get plots inline
%matplotlib inline
# select a year and plot rainfall through jun-sep for all subdivision
df_year.loc[2003,['SUBDIVISION','Jun-Sep']].plot(x='SUBDIVISION',kind='bar',figsize=(12,4))
<AxesSubplot:xlabel='SUBDIVISION'>
# function to convert datetime from strings to python recognized type for datetime
def tidy(df):
    df = df.copy()
    df['date'] = pd.to_datetime(df['year'].astype(str)+df['month'].astype(str),format='%Y%b')
    return df.set_index('date')
# reorient the data so that dates become the index and
# drop the columns to the right of "ANNUAL" column
df_clean= (df.loc[:,'SUBDIVISION':'DEC']
           .dropna(how='any')
          .set_index(['SUBDIVISION','YEAR'])
          .stack()
          .reset_index()
          .rename(columns={'YEAR':'year','level_2':'month',0:'precip','SUBDIVISION':'subdivision'})
          .reindex(columns=['subdivision','year','month','precip'])
          .pipe(tidy) # calls function tidy with preceeding dataframe as argument
          .drop(columns=['year','month'])
         )
df_clean.tail()
| subdivision | precip | |
|---|---|---|
| date | ||
| 2015-08-01 | LAKSHADWEEP | 146.4 |
| 2015-09-01 | LAKSHADWEEP | 160.4 |
| 2015-10-01 | LAKSHADWEEP | 165.4 |
| 2015-11-01 | LAKSHADWEEP | 231.0 |
| 2015-12-01 | LAKSHADWEEP | 159.0 |
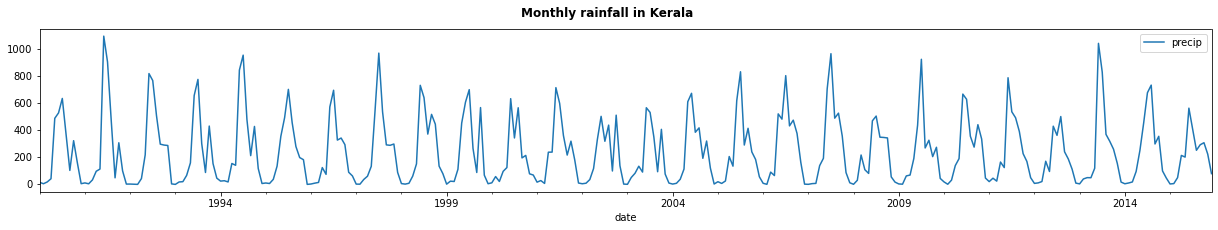
# select data for Kerala and plot
df_krl = df_clean.loc[df_clean['subdivision']=='KERALA',['precip']]
df_krl.loc['1990':'2015'].plot(figsize=(21,3))
plt.suptitle("Monthly rainfall in Kerala",fontweight='bold')
Text(0.5, 0.98, 'Monthly rainfall in Kerala')
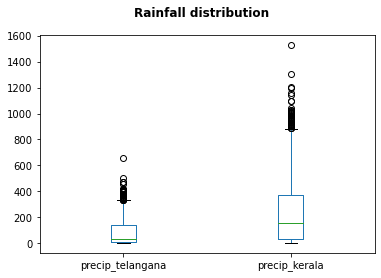
# select rainfall for Telangana state and join it to the dataframe for Kerala
df_tel = df_clean.loc[df_clean['subdivision']=='TELANGANA',['precip']]
df_join = df_tel.join(df_krl,lsuffix='_telangana',rsuffix='_kerala')
df_join.head()
| precip_telangana | precip_kerala | |
|---|---|---|
| date | ||
| 1901-01-01 | 6.9 | 28.7 |
| 1901-02-01 | 41.8 | 44.7 |
| 1901-03-01 | 7.8 | 51.6 |
| 1901-04-01 | 45.2 | 160.0 |
| 1901-05-01 | 22.0 | 174.7 |
df_join.plot(kind='box')
plt.suptitle("Rainfall distribution",fontweight='bold')
Text(0.5, 0.98, 'Rainfall distribution')
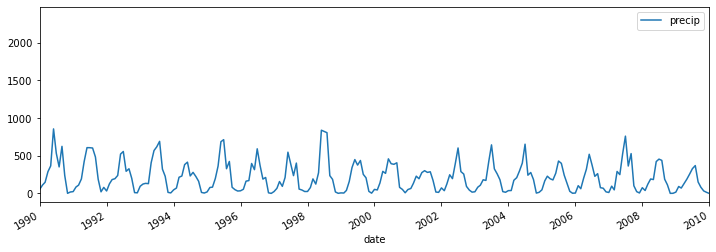
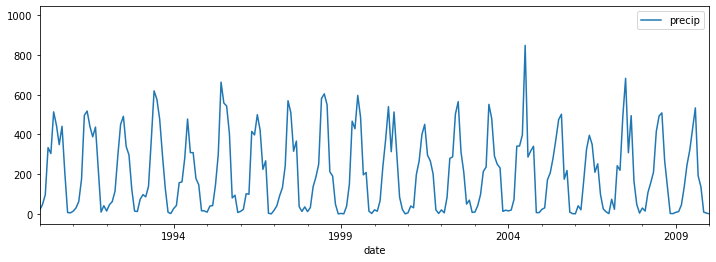
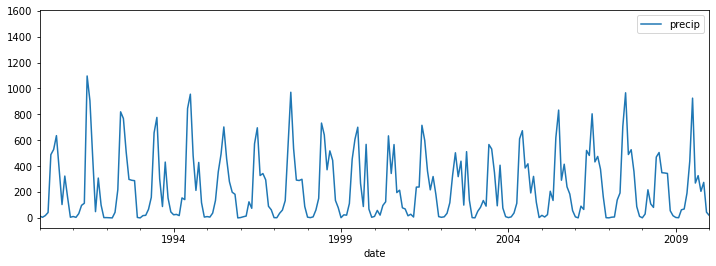
# groupby subdivisions and plot rainall time series for three selected subdivisions
selected_subd = ['KERALA','ARUNACHAL PRADESH','ASSAM & MEGHALAYA']
(df_clean.loc[df_clean['subdivision'].isin(selected_subd)]
         .groupby('subdivision').plot(figsize=(12,4),xlim=('1990','2010')))
subdivision
ARUNACHAL PRADESH       AxesSubplot(0.125,0.2;0.775x0.68)
ASSAM & MEGHALAYA    AxesSubplot(0.125,0.125;0.775x0.755)
KERALA               AxesSubplot(0.125,0.125;0.775x0.755)
dtype: object
Further references:
Definitely checout Pandas documentation page.
A course of basic Pandas can be found in the realpython website.
Also checkout tomaugspurger blog on Modern Pandas