Gridded data, NetCDF
Xarray
When working with higher dimensional data (3D or more), we can’t rely on Pandas. Here comes Xarray to the rescue.
It has Pandas like syntax, so if you know Pandas you will find yourself at home with Xarray.
format agnostic: It can read netCDF, GRIB, Zarr, raster files and also supports OPeNDAP.
No need to convert between file formats (GRIB to netCDF and such) as Xarray gives similar interface for all supported data formats.
It works well with larger than memory datasets, and you can run parallel processes with minimum-to-no code change.
It can save files in netCDF format as well, however does not impose CF convention by default.
Though it is a general purpose tool, Xarray is developed keeping in mind the need of oceanographic community.
Exercise
read satellite measured Sea Surface Temperature (SST) data (accessible from data directory) in netCDF format.
explore the data
select a region and plot spatial SST
select a few points and plot time series
comapre SST for two days by plotting side by side in a subplot
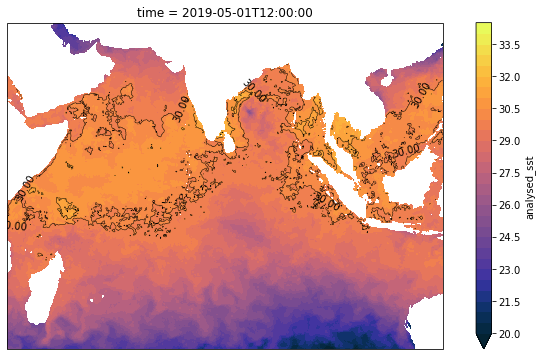
plot SST contour of greater than 30 degree Celcius
add LAND and coastline to a plot
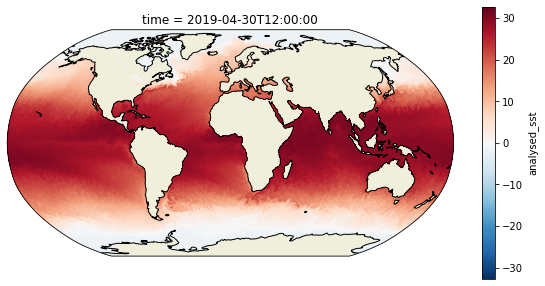
change the projection of a plot
import xarray as xr
import numpy as np
import cmocean # for perceptually uniform colormaps
import cartopy as cr # for geographic mapping
import cartopy.crs as ccrs # for map projections
import matplotlib.pyplot as plt # plotting tool
import cartopy.feature as cfeature # to add coastlines, land and ocean
from cartopy.mpl.gridliner import LONGITUDE_FORMATTER, LATITUDE_FORMATTER
# reads a single netCDF file
ds = xr.open_dataset('data/remss/20190426120000-REMSS-L4_GHRSST-SSTfnd-MW_IR_OI-GLOB-v02.0-fv05.0.nc')
# data details along with metadata
ds
<xarray.Dataset>
Dimensions:           (lat: 2048, lon: 4096, time: 1)
Coordinates:
  * lat               (lat) float32 -89.956 -89.86811 ... 89.86811 89.956
  * lon               (lon) float32 -179.956 -179.8681 ... 179.8681 179.956
  * time              (time) datetime64[ns] 2019-04-26T12:00:00
Data variables:
    analysed_sst      (time, lat, lon) float32 ...
    analysis_error    (time, lat, lon) float32 ...
    sea_ice_fraction  (time, lat, lon) float32 ...
    mask              (time, lat, lon) float32 ...
Attributes:
    Conventions:                CF-1.6,ACDD-1.3
    title:                      Analysed foundation sea surface temperature o...
    summary:                    A merged, multi-sensor L4 foundation SST prod...
    references:                 http://www.remss.com/measurements/sea-surface...
    institution:                REMSS
    history:                    2019-05-16 22:06:41-0700 created by fuse_sens...
    comment:                    This research was supported by the NASA Physi...
    license:                    GHRSST protocol describes data use as free an...
    id:                         REMSS-L4-MW_IR
    naming_authority:           org.ghrsst
    product_version:            v05.0
    uuid:                       d83a1d25-0b2b-4e74-aef8-bcc6d1f12ee6
    gds_version_id:             2.0
    netcdf_version_id:          4.6.1
    date_created:               20190517T050641Z
    file_quality_level:         3
    spatial_resolution:         9 km
    start_time:                 20190426T000000Z
    time_coverage_start:        20190426T000000Z
    stop_time:                  20190426T235959Z
    time_coverage_end:          20190426T235959Z
    northernmost_latitude:      90.0
    southernmost_latitude:      -90.0
    easternmost_longitude:      180.0
    westernmost_longitude:      -180.0
    source:                     OBPG-L3C-MODIS_Aqua,OBPG-L3C-MODIS_Terra,REMS...
    platform:                   Aqua,Coriolis,GCOM-W1,GPM,Terra
    sensor:                     AMSR-2,GMI,MODIS,WindSat
    Metadata_Conventions:       Unidata Dataset Discovery 1.0
    metadata_link:              https://podaac.jpl.nasa.gov/ws/metadata/datas...
    keywords:                   Oceans > Ocean Temperature > Sea Surface Temp...
    keywords_vocabulary:        NASA Global Change Master Directory (GCMD) Sc...
    standard_name_vocabulary:   NetCDF Climate and Forecast (CF) Metadata Con...
    geospatial_lat_units:       degrees_north
    geospatial_lat_resolution:  0.08789057
    geospatial_lon_units:       degrees_east
    geospatial_lon_resolution:  0.087890595
    acknowledgment:             http://www.remss.com/measurements/sea-surface...
    creator_name:               Remote Sensing Systems
    creator_email:              support@remss.com
    creator_url:                http://www.remss.com
    project:                    Group for High Resolution Sea Surface Tempera...
    publisher_name:             The GHRSST Project Office
    publisher_email:            ghrsst-po@nceo.ac.uk
    publisher_url:              http://www.ghrsst.org
    processing_level:           L4
cdm_data_type: grid- lat: 2048
- lon: 4096
- time: 1
- lat(lat)float32-89.956 -89.86811 ... 89.956
- units :
- degrees_north
- standard_name :
- latitude
- axis :
- Y
- valid_min :
- -90.0
- valid_max :
- 90.0
- comment :
- geographical coordinates, WGS84 datum
array([-89.956 , -89.86811, -89.78022, ..., 89.78022, 89.86811, 89.956 ], dtype=float32) - lon(lon)float32-179.956 -179.8681 ... 179.956
- units :
- degrees_east
- standard_name :
- longitude
- axis :
- X
- valid_min :
- -180.0
- valid_max :
- 180.0
- comment :
- geographical coordinates, WGS84 datum
array([-179.956 , -179.8681 , -179.78021, ..., 179.78021, 179.8681 , 179.956 ], dtype=float32) - time(time)datetime64[ns]2019-04-26T12:00:00
- standard_name :
- time
- axis :
- T
- long_name :
- nominal time of L4 analysis
array(['2019-04-26T12:00:00.000000000'], dtype='datetime64[ns]')
- analysed_sst(time, lat, lon)float32...
- units :
- K
- long_name :
- analysed sea surface temperature
- standard_name :
- sea_surface_foundation_temperature
- valid_min :
- -200
- valid_max :
- 5000
- source :
- OBPG-L3C-MODIS_Aqua,OBPG-L3C-MODIS_Terra,REMSS-L3C-AMSR2,REMSS-L3C-GMI,REMSS-L3C-WindSat,REMSS-L4-MW_IR
[8388608 values with dtype=float32]
- analysis_error(time, lat, lon)float32...
- units :
- K
- long_name :
- estimated error standard deviation of analysed_sst
- valid_min :
- 0
- valid_max :
- 32767
[8388608 values with dtype=float32]
- sea_ice_fraction(time, lat, lon)float32...
- units :
- 1
- standard_name :
- sea_ice_area_fraction
- long_name :
- sea ice area fraction
- valid_min :
- 0
- valid_max :
- 100
- source :
- EUMETSAT OSI-SAF OSI-401b
[8388608 values with dtype=float32]
- mask(time, lat, lon)float32...
- long_name :
- land sea ice lake bit mask
- valid_min :
- 0
- valid_max :
- 127
- flag_masks :
- [ 1 2 4 8 16 32 64]
- flag_meanings :
- water land optional_lake_surface sea_ice optional_river_surface IR_data MW_data
[8388608 values with dtype=float32]
- Conventions :
- CF-1.6,ACDD-1.3
- title :
- Analysed foundation sea surface temperature over the global ocean
- summary :
- A merged, multi-sensor L4 foundation SST product from Remote Sensing Systems
- references :
- http://www.remss.com/measurements/sea-surface-temperature/oisst-description
- institution :
- REMSS
- history :
- 2019-05-16 22:06:41-0700 created by fuse_sensor_data.py v0.5
- comment :
- This research was supported by the NASA Physical Oceanography Program
- license :
- GHRSST protocol describes data use as free and open
- id :
- REMSS-L4-MW_IR
- naming_authority :
- org.ghrsst
- product_version :
- v05.0
- uuid :
- d83a1d25-0b2b-4e74-aef8-bcc6d1f12ee6
- gds_version_id :
- 2.0
- netcdf_version_id :
- 4.6.1
- date_created :
- 20190517T050641Z
- file_quality_level :
- 3
- spatial_resolution :
- 9 km
- start_time :
- 20190426T000000Z
- time_coverage_start :
- 20190426T000000Z
- stop_time :
- 20190426T235959Z
- time_coverage_end :
- 20190426T235959Z
- northernmost_latitude :
- 90.0
- southernmost_latitude :
- -90.0
- easternmost_longitude :
- 180.0
- westernmost_longitude :
- -180.0
- source :
- OBPG-L3C-MODIS_Aqua,OBPG-L3C-MODIS_Terra,REMSS-L3C-AMSR2,REMSS-L3C-GMI,REMSS-L3C-WindSat,REMSS-L4-MW_IR
- platform :
- Aqua,Coriolis,GCOM-W1,GPM,Terra
- sensor :
- AMSR-2,GMI,MODIS,WindSat
- Metadata_Conventions :
- Unidata Dataset Discovery 1.0
- metadata_link :
- https://podaac.jpl.nasa.gov/ws/metadata/dataset/?shortName=MW_IR_OI-REMSS-L4-GLOB-v5.0&format=iso
- keywords :
- Oceans > Ocean Temperature > Sea Surface Temperature
- keywords_vocabulary :
- NASA Global Change Master Directory (GCMD) Science Keywords
- standard_name_vocabulary :
- NetCDF Climate and Forecast (CF) Metadata Convention
- geospatial_lat_units :
- degrees_north
- geospatial_lat_resolution :
- 0.08789057
- geospatial_lon_units :
- degrees_east
- geospatial_lon_resolution :
- 0.087890595
- acknowledgment :
- http://www.remss.com/measurements/sea-surface-temperature/oisst-description
- creator_name :
- Remote Sensing Systems
- creator_email :
- support@remss.com
- creator_url :
- http://www.remss.com
- project :
- Group for High Resolution Sea Surface Temperature
- publisher_name :
- The GHRSST Project Office
- publisher_email :
- ghrsst-po@nceo.ac.uk
- publisher_url :
- http://www.ghrsst.org
- processing_level :
- L4
- cdm_data_type :
- grid
# variables in the dataset
ds.data_vars
Data variables:
    analysed_sst      (time, lat, lon) float32 ...
    analysis_error    (time, lat, lon) float32 ...
    sea_ice_fraction  (time, lat, lon) float32 ...
    mask              (time, lat, lon) float32 ...
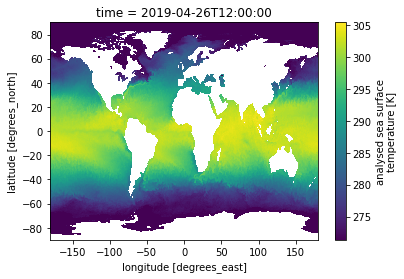
# select one variable and plot
# since data is 2D meshgrid, it plots colormesh by default
ds.analysed_sst.plot()
<matplotlib.collections.QuadMesh at 0x7f5d2849cb80>
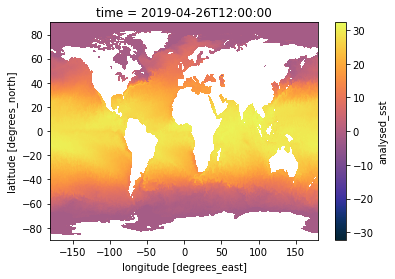
# changing values in a variable
# here, SST is converted from degree Kelvin to degree Celcius
(ds.analysed_sst-273.15).plot(cmap='cmo.thermal')
<matplotlib.collections.QuadMesh at 0x7f5d2836b820>
# change is not affected unless it is saved to the variable
ds_sst = ds.analysed_sst - 273.15
# uncomment line to save data in netCDF
#ds_sst.to_netcdf('data/SSTinCelcius.nc')
# printsdata underneath a variable, which is numpy array
ds_sst.data
array([[[       nan,        nan,        nan, ...,        nan,
                nan,        nan],
        [       nan,        nan,        nan, ...,        nan,
                nan,        nan],
        [       nan,        nan,        nan, ...,        nan,
                nan,        nan],
        ...,
        [-1.7999878, -1.7999878, -1.7999878, ..., -1.7999878,
         -1.7999878, -1.7999878],
        [-1.7999878, -1.7999878, -1.7999878, ..., -1.7999878,
         -1.7999878, -1.7999878],
        [-1.7999878, -1.7999878, -1.7999878, ..., -1.7999878,
         -1.7999878, -1.7999878]]], dtype=float32)
# shape of numpy array
ds_sst.data.shape
(1, 2048, 4096)
# coordinates can be accessed the same way as variables
ds_sst.time
# or ds_sst['time']
<xarray.DataArray 'time' (time: 1)>
array(['2019-04-26T12:00:00.000000000'], dtype='datetime64[ns]')
Coordinates:
  * time     (time) datetime64[ns] 2019-04-26T12:00:00
Attributes:
    standard_name:  time
    axis:           T
long_name: nominal time of L4 analysis- time: 1
- 2019-04-26T12:00:00
array(['2019-04-26T12:00:00.000000000'], dtype='datetime64[ns]')
- time(time)datetime64[ns]2019-04-26T12:00:00
- standard_name :
- time
- axis :
- T
- long_name :
- nominal time of L4 analysis
array(['2019-04-26T12:00:00.000000000'], dtype='datetime64[ns]')
- standard_name :
- time
- axis :
- T
- long_name :
- nominal time of L4 analysis
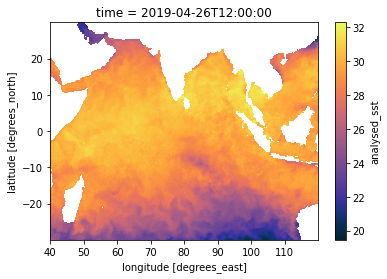
# selecting a region
ds_sst.sel(lon=slice(40,120),lat=slice(-30,30)).plot(cmap='cmo.thermal')
<matplotlib.collections.QuadMesh at 0x7f5d2829fd00>
# read and combine many files along a dimension
ds_comb = xr.open_mfdataset('data/remss/*.nc',combine='by_coords')
# time coordinate now has 10 values instead of one
# data combined in time dimension
ds_comb
<xarray.Dataset>
Dimensions:           (lat: 2048, lon: 4096, time: 10)
Coordinates:
  * lat               (lat) float32 -89.956 -89.86811 ... 89.86811 89.956
  * lon               (lon) float32 -179.956 -179.8681 ... 179.8681 179.956
  * time              (time) datetime64[ns] 2019-04-26T12:00:00 ... 2019-05-0...
Data variables:
    analysed_sst      (time, lat, lon) float32 dask.array<chunksize=(1, 2048, 4096), meta=np.ndarray>
    analysis_error    (time, lat, lon) float32 dask.array<chunksize=(1, 2048, 4096), meta=np.ndarray>
    sea_ice_fraction  (time, lat, lon) float32 dask.array<chunksize=(1, 2048, 4096), meta=np.ndarray>
    mask              (time, lat, lon) float32 dask.array<chunksize=(1, 2048, 4096), meta=np.ndarray>
Attributes:
    Conventions:                CF-1.6,ACDD-1.3
    title:                      Analysed foundation sea surface temperature o...
    summary:                    A merged, multi-sensor L4 foundation SST prod...
    references:                 http://www.remss.com/measurements/sea-surface...
    institution:                REMSS
    history:                    2019-05-16 22:06:41-0700 created by fuse_sens...
    comment:                    This research was supported by the NASA Physi...
    license:                    GHRSST protocol describes data use as free an...
    id:                         REMSS-L4-MW_IR
    naming_authority:           org.ghrsst
    product_version:            v05.0
    uuid:                       d83a1d25-0b2b-4e74-aef8-bcc6d1f12ee6
    gds_version_id:             2.0
    netcdf_version_id:          4.6.1
    date_created:               20190517T050641Z
    file_quality_level:         3
    spatial_resolution:         9 km
    start_time:                 20190426T000000Z
    time_coverage_start:        20190426T000000Z
    stop_time:                  20190426T235959Z
    time_coverage_end:          20190426T235959Z
    northernmost_latitude:      90.0
    southernmost_latitude:      -90.0
    easternmost_longitude:      180.0
    westernmost_longitude:      -180.0
    source:                     OBPG-L3C-MODIS_Aqua,OBPG-L3C-MODIS_Terra,REMS...
    platform:                   Aqua,Coriolis,GCOM-W1,GPM,Terra
    sensor:                     AMSR-2,GMI,MODIS,WindSat
    Metadata_Conventions:       Unidata Dataset Discovery 1.0
    metadata_link:              https://podaac.jpl.nasa.gov/ws/metadata/datas...
    keywords:                   Oceans > Ocean Temperature > Sea Surface Temp...
    keywords_vocabulary:        NASA Global Change Master Directory (GCMD) Sc...
    standard_name_vocabulary:   NetCDF Climate and Forecast (CF) Metadata Con...
    geospatial_lat_units:       degrees_north
    geospatial_lat_resolution:  0.08789057
    geospatial_lon_units:       degrees_east
    geospatial_lon_resolution:  0.087890595
    acknowledgment:             http://www.remss.com/measurements/sea-surface...
    creator_name:               Remote Sensing Systems
    creator_email:              support@remss.com
    creator_url:                http://www.remss.com
    project:                    Group for High Resolution Sea Surface Tempera...
    publisher_name:             The GHRSST Project Office
    publisher_email:            ghrsst-po@nceo.ac.uk
    publisher_url:              http://www.ghrsst.org
    processing_level:           L4
cdm_data_type: grid- lat: 2048
- lon: 4096
- time: 10
- lat(lat)float32-89.956 -89.86811 ... 89.956
- units :
- degrees_north
- standard_name :
- latitude
- axis :
- Y
- valid_min :
- -90.0
- valid_max :
- 90.0
- comment :
- geographical coordinates, WGS84 datum
array([-89.956 , -89.86811, -89.78022, ..., 89.78022, 89.86811, 89.956 ], dtype=float32) - lon(lon)float32-179.956 -179.8681 ... 179.956
- units :
- degrees_east
- standard_name :
- longitude
- axis :
- X
- valid_min :
- -180.0
- valid_max :
- 180.0
- comment :
- geographical coordinates, WGS84 datum
array([-179.956 , -179.8681 , -179.78021, ..., 179.78021, 179.8681 , 179.956 ], dtype=float32) - time(time)datetime64[ns]2019-04-26T12:00:00 ... 2019-05-...
- standard_name :
- time
- axis :
- T
- long_name :
- nominal time of L4 analysis
array(['2019-04-26T12:00:00.000000000', '2019-04-27T12:00:00.000000000',
       '2019-04-28T12:00:00.000000000', '2019-04-29T12:00:00.000000000',
       '2019-04-30T12:00:00.000000000', '2019-05-01T12:00:00.000000000',
       '2019-05-02T12:00:00.000000000', '2019-05-03T12:00:00.000000000',
       '2019-05-04T12:00:00.000000000', '2019-05-05T12:00:00.000000000'],
      dtype='datetime64[ns]')
- analysed_sst(time, lat, lon)float32dask.array<chunksize=(1, 2048, 4096), meta=np.ndarray>
- units :
- K
- long_name :
- analysed sea surface temperature
- standard_name :
- sea_surface_foundation_temperature
- valid_min :
- -200
- valid_max :
- 5000
- source :
- OBPG-L3C-MODIS_Aqua,OBPG-L3C-MODIS_Terra,REMSS-L3C-AMSR2,REMSS-L3C-GMI,REMSS-L3C-WindSat,REMSS-L4-MW_IR
Array Chunk Bytes 335.54 MB 33.55 MB Shape (10, 2048, 4096) (1, 2048, 4096) Count 30 Tasks 10 Chunks Type float32 numpy.ndarray - analysis_error(time, lat, lon)float32dask.array<chunksize=(1, 2048, 4096), meta=np.ndarray>
- units :
- K
- long_name :
- estimated error standard deviation of analysed_sst
- valid_min :
- 0
- valid_max :
- 32767
Array Chunk Bytes 335.54 MB 33.55 MB Shape (10, 2048, 4096) (1, 2048, 4096) Count 30 Tasks 10 Chunks Type float32 numpy.ndarray - sea_ice_fraction(time, lat, lon)float32dask.array<chunksize=(1, 2048, 4096), meta=np.ndarray>
- units :
- 1
- standard_name :
- sea_ice_area_fraction
- long_name :
- sea ice area fraction
- valid_min :
- 0
- valid_max :
- 100
- source :
- EUMETSAT OSI-SAF OSI-401b
Array Chunk Bytes 335.54 MB 33.55 MB Shape (10, 2048, 4096) (1, 2048, 4096) Count 30 Tasks 10 Chunks Type float32 numpy.ndarray - mask(time, lat, lon)float32dask.array<chunksize=(1, 2048, 4096), meta=np.ndarray>
- long_name :
- land sea ice lake bit mask
- valid_min :
- 0
- valid_max :
- 127
- flag_masks :
- [ 1 2 4 8 16 32 64]
- flag_meanings :
- water land optional_lake_surface sea_ice optional_river_surface IR_data MW_data
Array Chunk Bytes 335.54 MB 33.55 MB Shape (10, 2048, 4096) (1, 2048, 4096) Count 30 Tasks 10 Chunks Type float32 numpy.ndarray
- Conventions :
- CF-1.6,ACDD-1.3
- title :
- Analysed foundation sea surface temperature over the global ocean
- summary :
- A merged, multi-sensor L4 foundation SST product from Remote Sensing Systems
- references :
- http://www.remss.com/measurements/sea-surface-temperature/oisst-description
- institution :
- REMSS
- history :
- 2019-05-16 22:06:41-0700 created by fuse_sensor_data.py v0.5
- comment :
- This research was supported by the NASA Physical Oceanography Program
- license :
- GHRSST protocol describes data use as free and open
- id :
- REMSS-L4-MW_IR
- naming_authority :
- org.ghrsst
- product_version :
- v05.0
- uuid :
- d83a1d25-0b2b-4e74-aef8-bcc6d1f12ee6
- gds_version_id :
- 2.0
- netcdf_version_id :
- 4.6.1
- date_created :
- 20190517T050641Z
- file_quality_level :
- 3
- spatial_resolution :
- 9 km
- start_time :
- 20190426T000000Z
- time_coverage_start :
- 20190426T000000Z
- stop_time :
- 20190426T235959Z
- time_coverage_end :
- 20190426T235959Z
- northernmost_latitude :
- 90.0
- southernmost_latitude :
- -90.0
- easternmost_longitude :
- 180.0
- westernmost_longitude :
- -180.0
- source :
- OBPG-L3C-MODIS_Aqua,OBPG-L3C-MODIS_Terra,REMSS-L3C-AMSR2,REMSS-L3C-GMI,REMSS-L3C-WindSat,REMSS-L4-MW_IR
- platform :
- Aqua,Coriolis,GCOM-W1,GPM,Terra
- sensor :
- AMSR-2,GMI,MODIS,WindSat
- Metadata_Conventions :
- Unidata Dataset Discovery 1.0
- metadata_link :
- https://podaac.jpl.nasa.gov/ws/metadata/dataset/?shortName=MW_IR_OI-REMSS-L4-GLOB-v5.0&format=iso
- keywords :
- Oceans > Ocean Temperature > Sea Surface Temperature
- keywords_vocabulary :
- NASA Global Change Master Directory (GCMD) Science Keywords
- standard_name_vocabulary :
- NetCDF Climate and Forecast (CF) Metadata Convention
- geospatial_lat_units :
- degrees_north
- geospatial_lat_resolution :
- 0.08789057
- geospatial_lon_units :
- degrees_east
- geospatial_lon_resolution :
- 0.087890595
- acknowledgment :
- http://www.remss.com/measurements/sea-surface-temperature/oisst-description
- creator_name :
- Remote Sensing Systems
- creator_email :
- support@remss.com
- creator_url :
- http://www.remss.com
- project :
- Group for High Resolution Sea Surface Temperature
- publisher_name :
- The GHRSST Project Office
- publisher_email :
- ghrsst-po@nceo.ac.uk
- publisher_url :
- http://www.ghrsst.org
- processing_level :
- L4
- cdm_data_type :
- grid
# shape of combined data
ds_comb.analysed_sst.shape
(10, 2048, 4096)
# time information was read in from each file and appended
ds_comb.time.data
array(['2019-04-26T12:00:00.000000000', '2019-04-27T12:00:00.000000000',
       '2019-04-28T12:00:00.000000000', '2019-04-29T12:00:00.000000000',
       '2019-04-30T12:00:00.000000000', '2019-05-01T12:00:00.000000000',
       '2019-05-02T12:00:00.000000000', '2019-05-03T12:00:00.000000000',
       '2019-05-04T12:00:00.000000000', '2019-05-05T12:00:00.000000000'],
      dtype='datetime64[ns]')
# convert SST from degree Kelvin to degree Celcius
ds_sst_comb = ds_comb.analysed_sst - 273.15
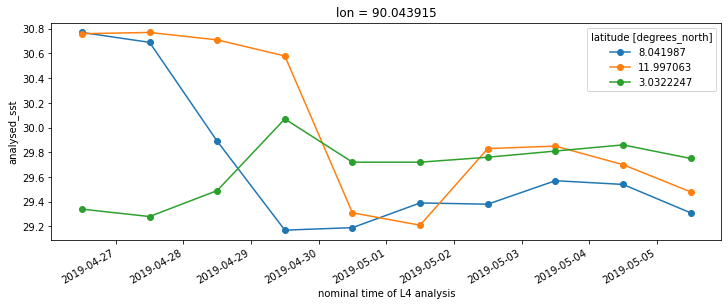
# select a few points and plot time series
ds_sst_comb.sel(lat=[8,12,3],lon=90,method='nearest').plot(hue='lat',figsize=(12,4),marker='o')
[<matplotlib.lines.Line2D at 0x7f5d2818ea90>,
 <matplotlib.lines.Line2D at 0x7f5d2692efa0>,
 <matplotlib.lines.Line2D at 0x7f5d2692eee0>]
# plot SST for two days (2019-04-29 and 2019-04-30) side by side
fig,ax = plt.subplots(1,2,figsize=(16,5),subplot_kw={'projection':ccrs.PlateCarree()})
ds_sst_comb.isel(time=3).sel(lon=slice(40,120),lat=slice(-30,30)).plot(ax=ax[0],cmap='cmo.thermal',levels=np.arange(20,35,1))
ds_sst_comb.isel(time=4).sel(lon=slice(40,120),lat=slice(-30,30)).plot(ax=ax[1],cmap='cmo.thermal',levels=np.arange(20,35,1))
<matplotlib.collections.QuadMesh at 0x7f5d2688fd60>

# add land feature, coastlines and format lat lon labels
import go_land # see the file go_land.py
fig,ax = plt.subplots(1,2,figsize=(16,5),subplot_kw={'projection':ccrs.PlateCarree()})
ds_sst_comb.isel(time=4).sel(lon=slice(40,120),lat=slice(-30,30)).plot(ax=ax[0],cmap='cmo.thermal',levels=np.arange(20,35,1))
ds_sst_comb.isel(time=6).sel(lon=slice(40,120),lat=slice(-30,30)).plot(ax=ax[1],cmap='cmo.thermal',levels=np.arange(20,35,1))
for p in ax:
    go_land.fig_beauty(ax=p)
/home/lijo/miniconda3/envs/XR/lib/python3.8/site-packages/cartopy/mpl/gridliner.py:319: UserWarning: The .xlabels_bottom attribute is deprecated. Please use .bottom_labels to toggle visibility instead.
  warnings.warn('The .xlabels_bottom attribute is deprecated. Please '
/home/lijo/miniconda3/envs/XR/lib/python3.8/site-packages/cartopy/mpl/gridliner.py:331: UserWarning: The .ylabels_left attribute is deprecated. Please use .left_labels to toggle visibility instead.
  warnings.warn('The .ylabels_left attribute is deprecated. Please '

# add contours for temperatures above 30 degree Celcius
fig,ax = plt.subplots(figsize=(12,6),subplot_kw={'projection':ccrs.PlateCarree()})
cf = ds_sst_comb.isel(time=5).sel(lon=slice(40,120),lat=slice(-30,30)).plot.contourf(ax=ax,cmap='cmo.thermal',levels=np.arange(20,35,0.5))
c = ax.contour(cf,levels=np.arange(30,35,1),colors='black',linewidths=0.5)
ax.clabel(c,inline=True,fmt='%3.2f')
/home/lijo/miniconda3/envs/XR/lib/python3.8/site-packages/xarray/plot/utils.py:624: MatplotlibDeprecationWarning: The 'extend' parameter to Colorbar has no effect because it is overridden by the mappable; it is deprecated since 3.3 and will be removed two minor releases later.
  cbar = fig.colorbar(primitive, **cbar_kwargs)
# change in plot projection
fig,ax = plt.subplots(subplot_kw={'projection':ccrs.Robinson()},figsize=(10,5))
ds_sst_comb.sel(time='2019-04-30').plot(ax=ax,transform=ccrs.PlateCarree())
ax.coastlines()
ax.add_feature(cfeature.LAND)
<cartopy.mpl.feature_artist.FeatureArtist at 0x7f5d26637130>
Further resources
Documentation page for Xarray well explains use cases and has a lots of examples
Workshop by Fabien Maussion on Xarray usage
